Core Dump Generic Analysis
OpenResty XRay supports analyzing the core files generated by OpenResty and C/C++ applications, which can help locate the cause of abnormal program crashes.
As shown in the figure below, the entry point for this feature is located at:
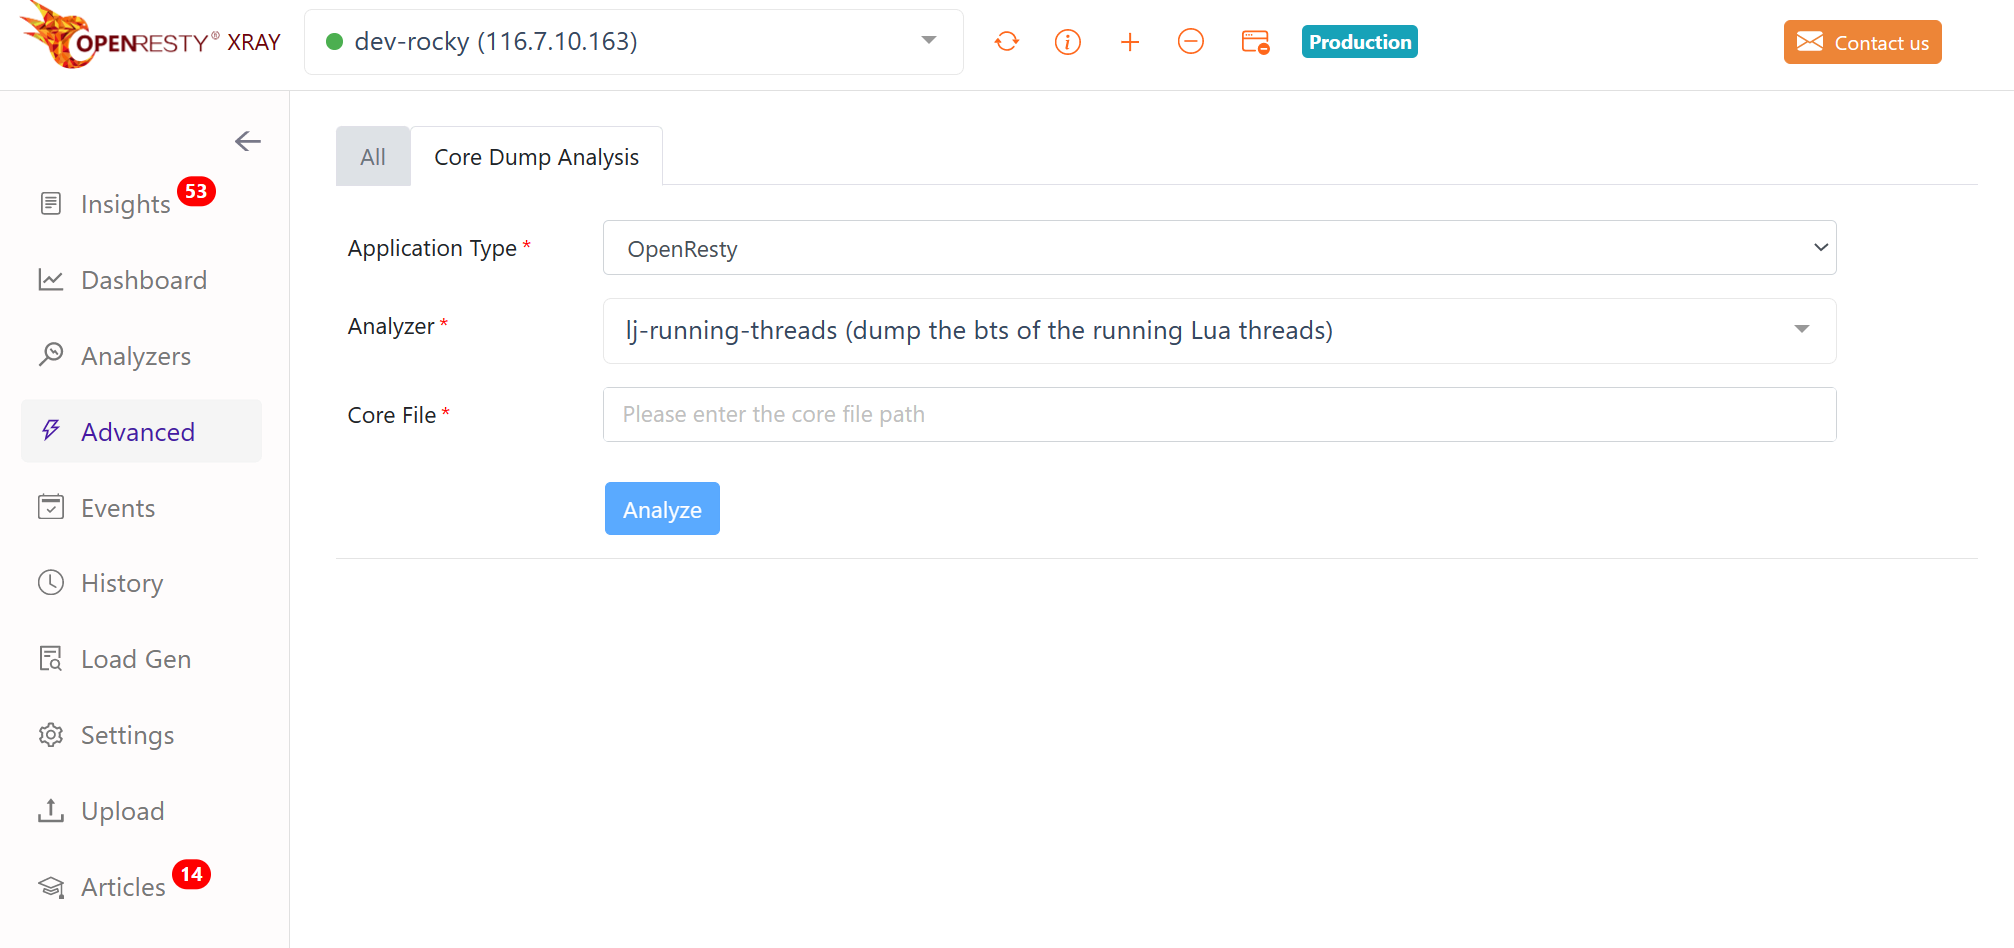
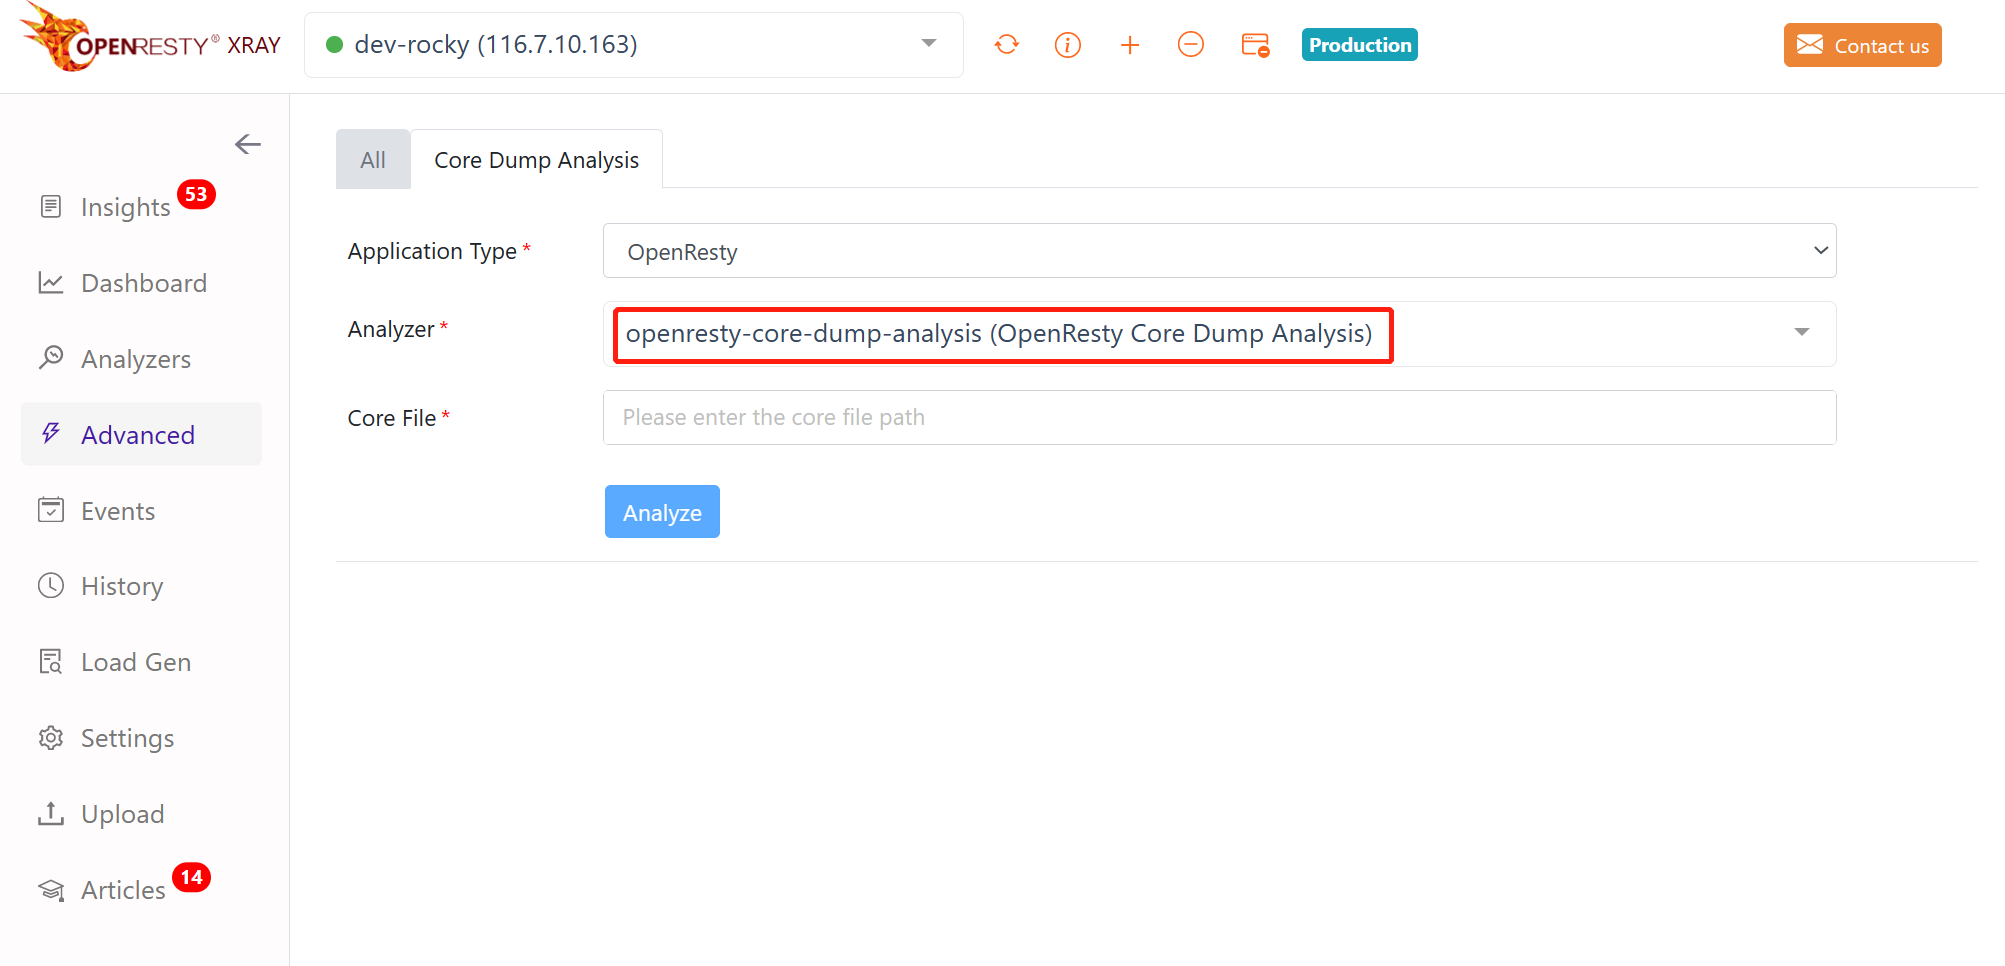
To start analyzing the core file, first select the application type corresponding to the core file. The system will automatically filter the list of corresponding standard analyzers according to the application type.
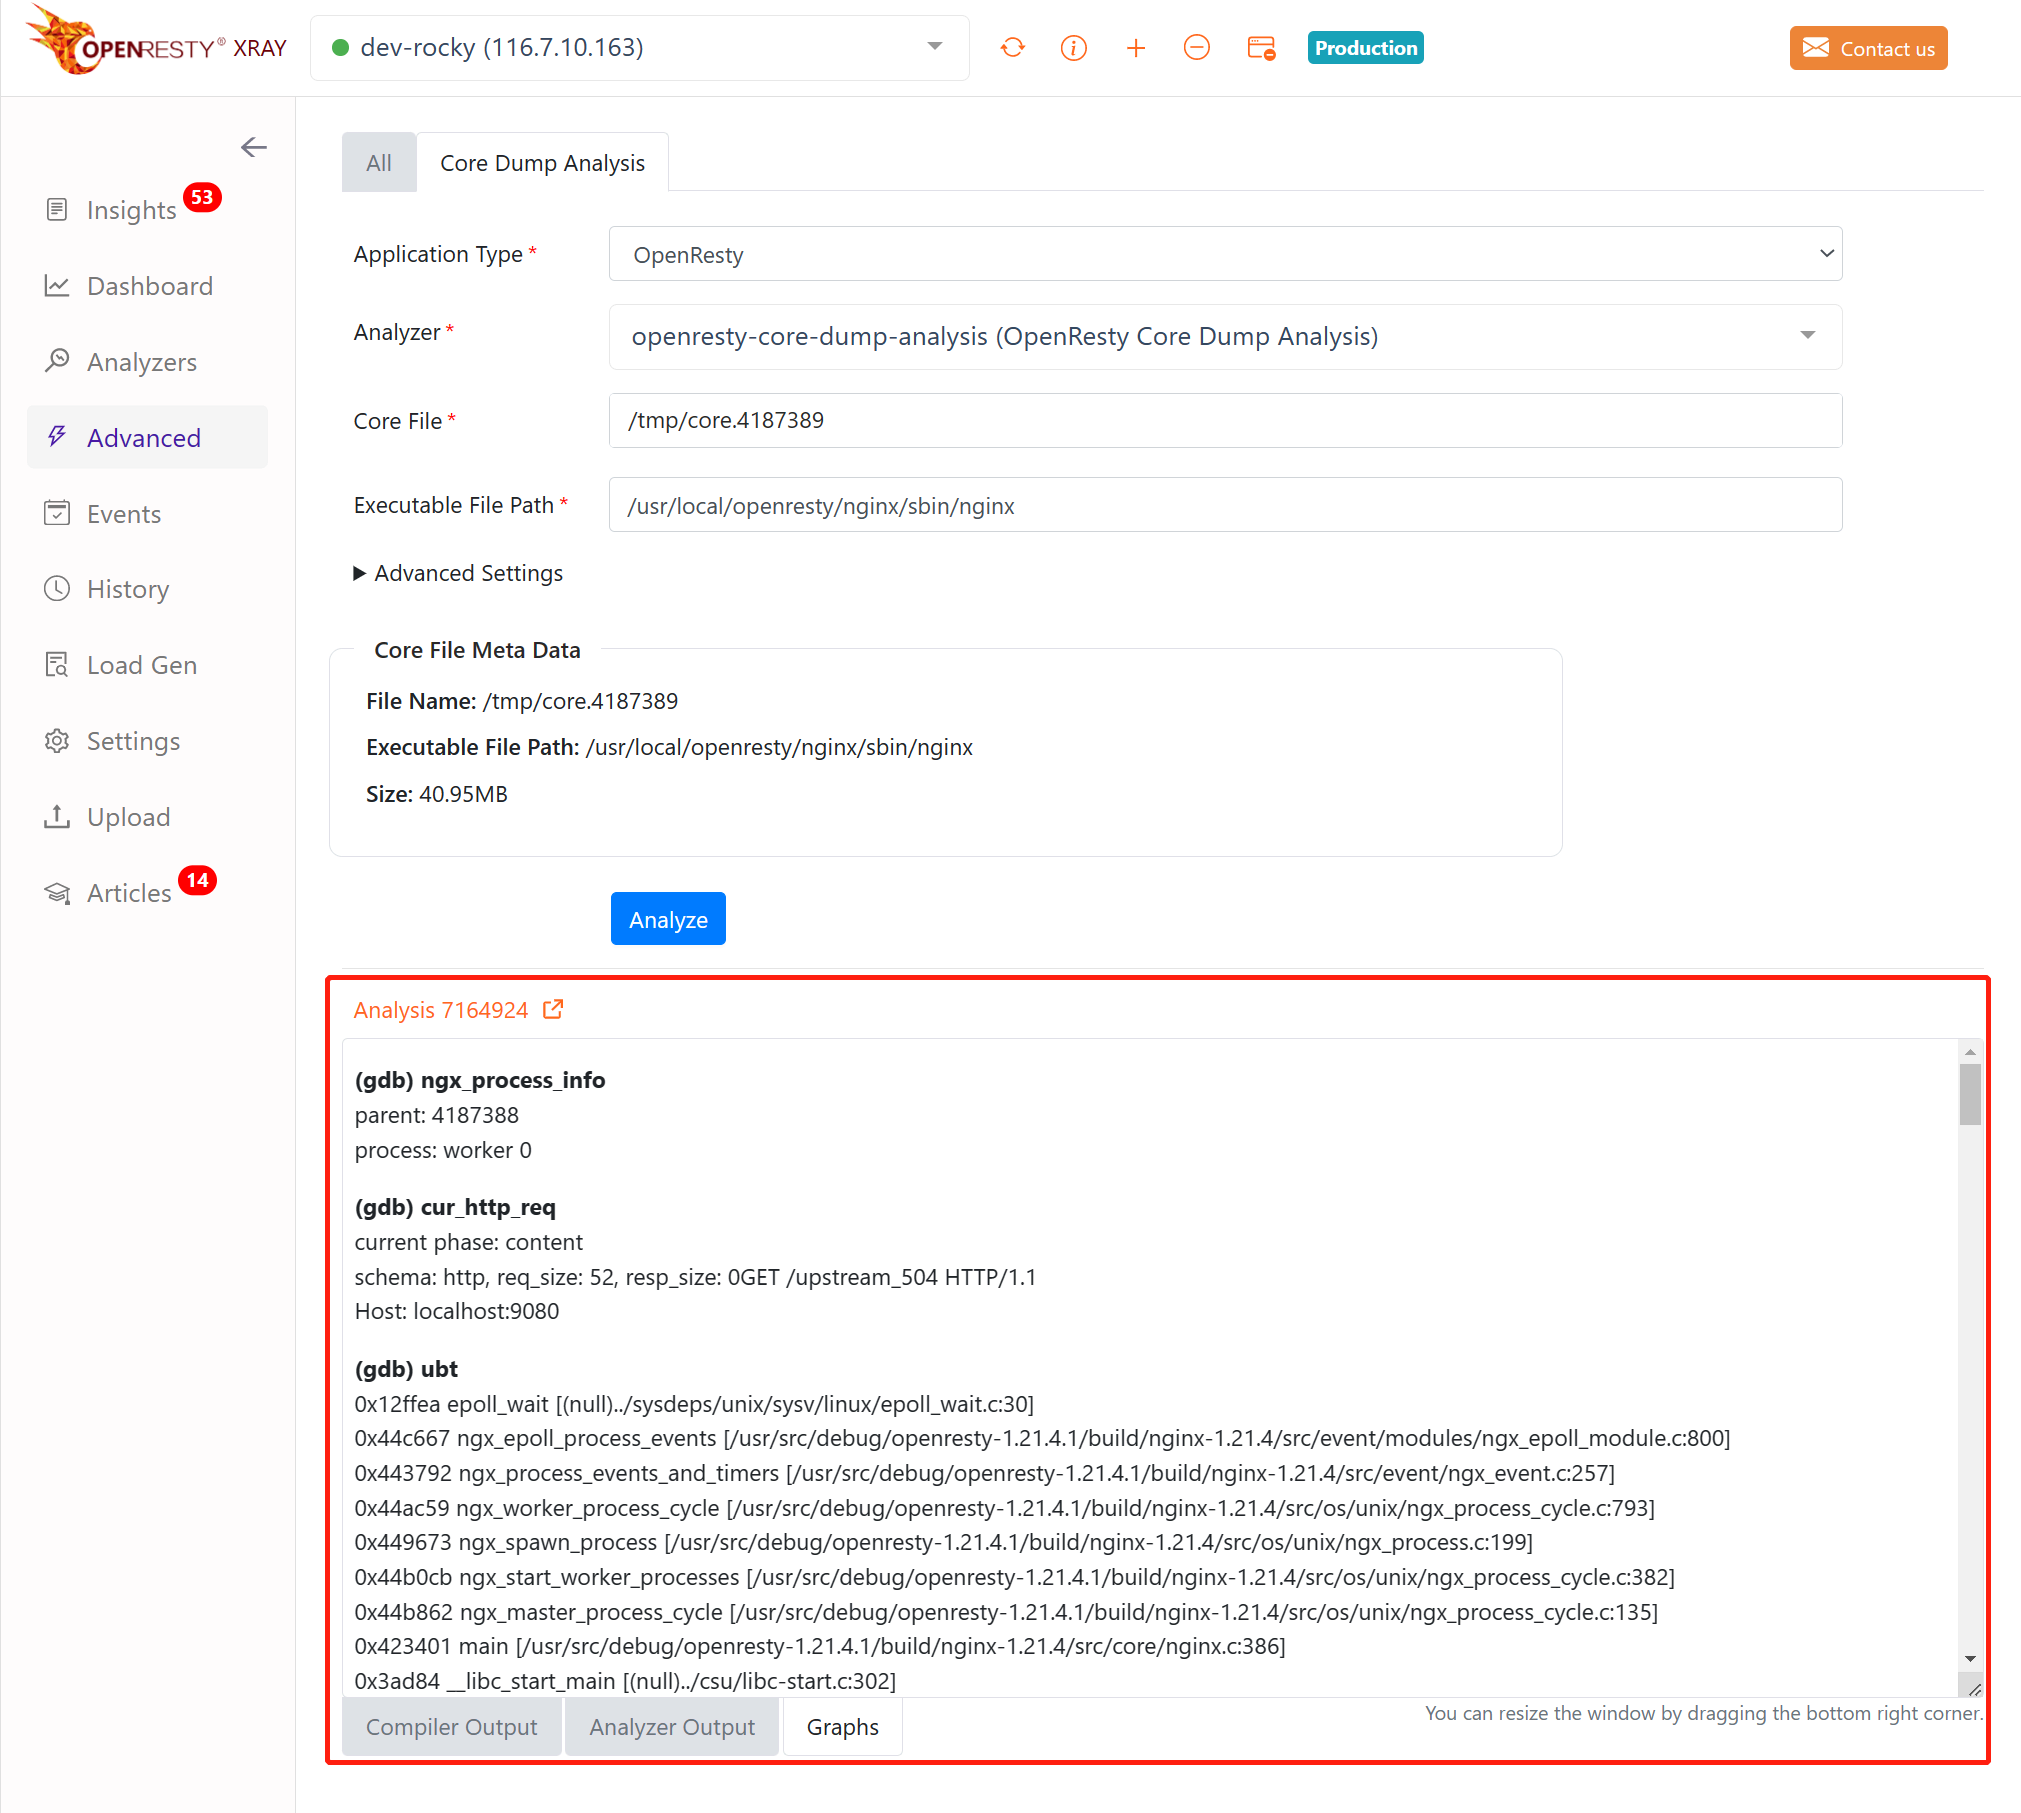
For example, to analyze core files generated by OpenResty, we would select the OpenResty application type and choose the openresty-core-dump-analysis analyzer.
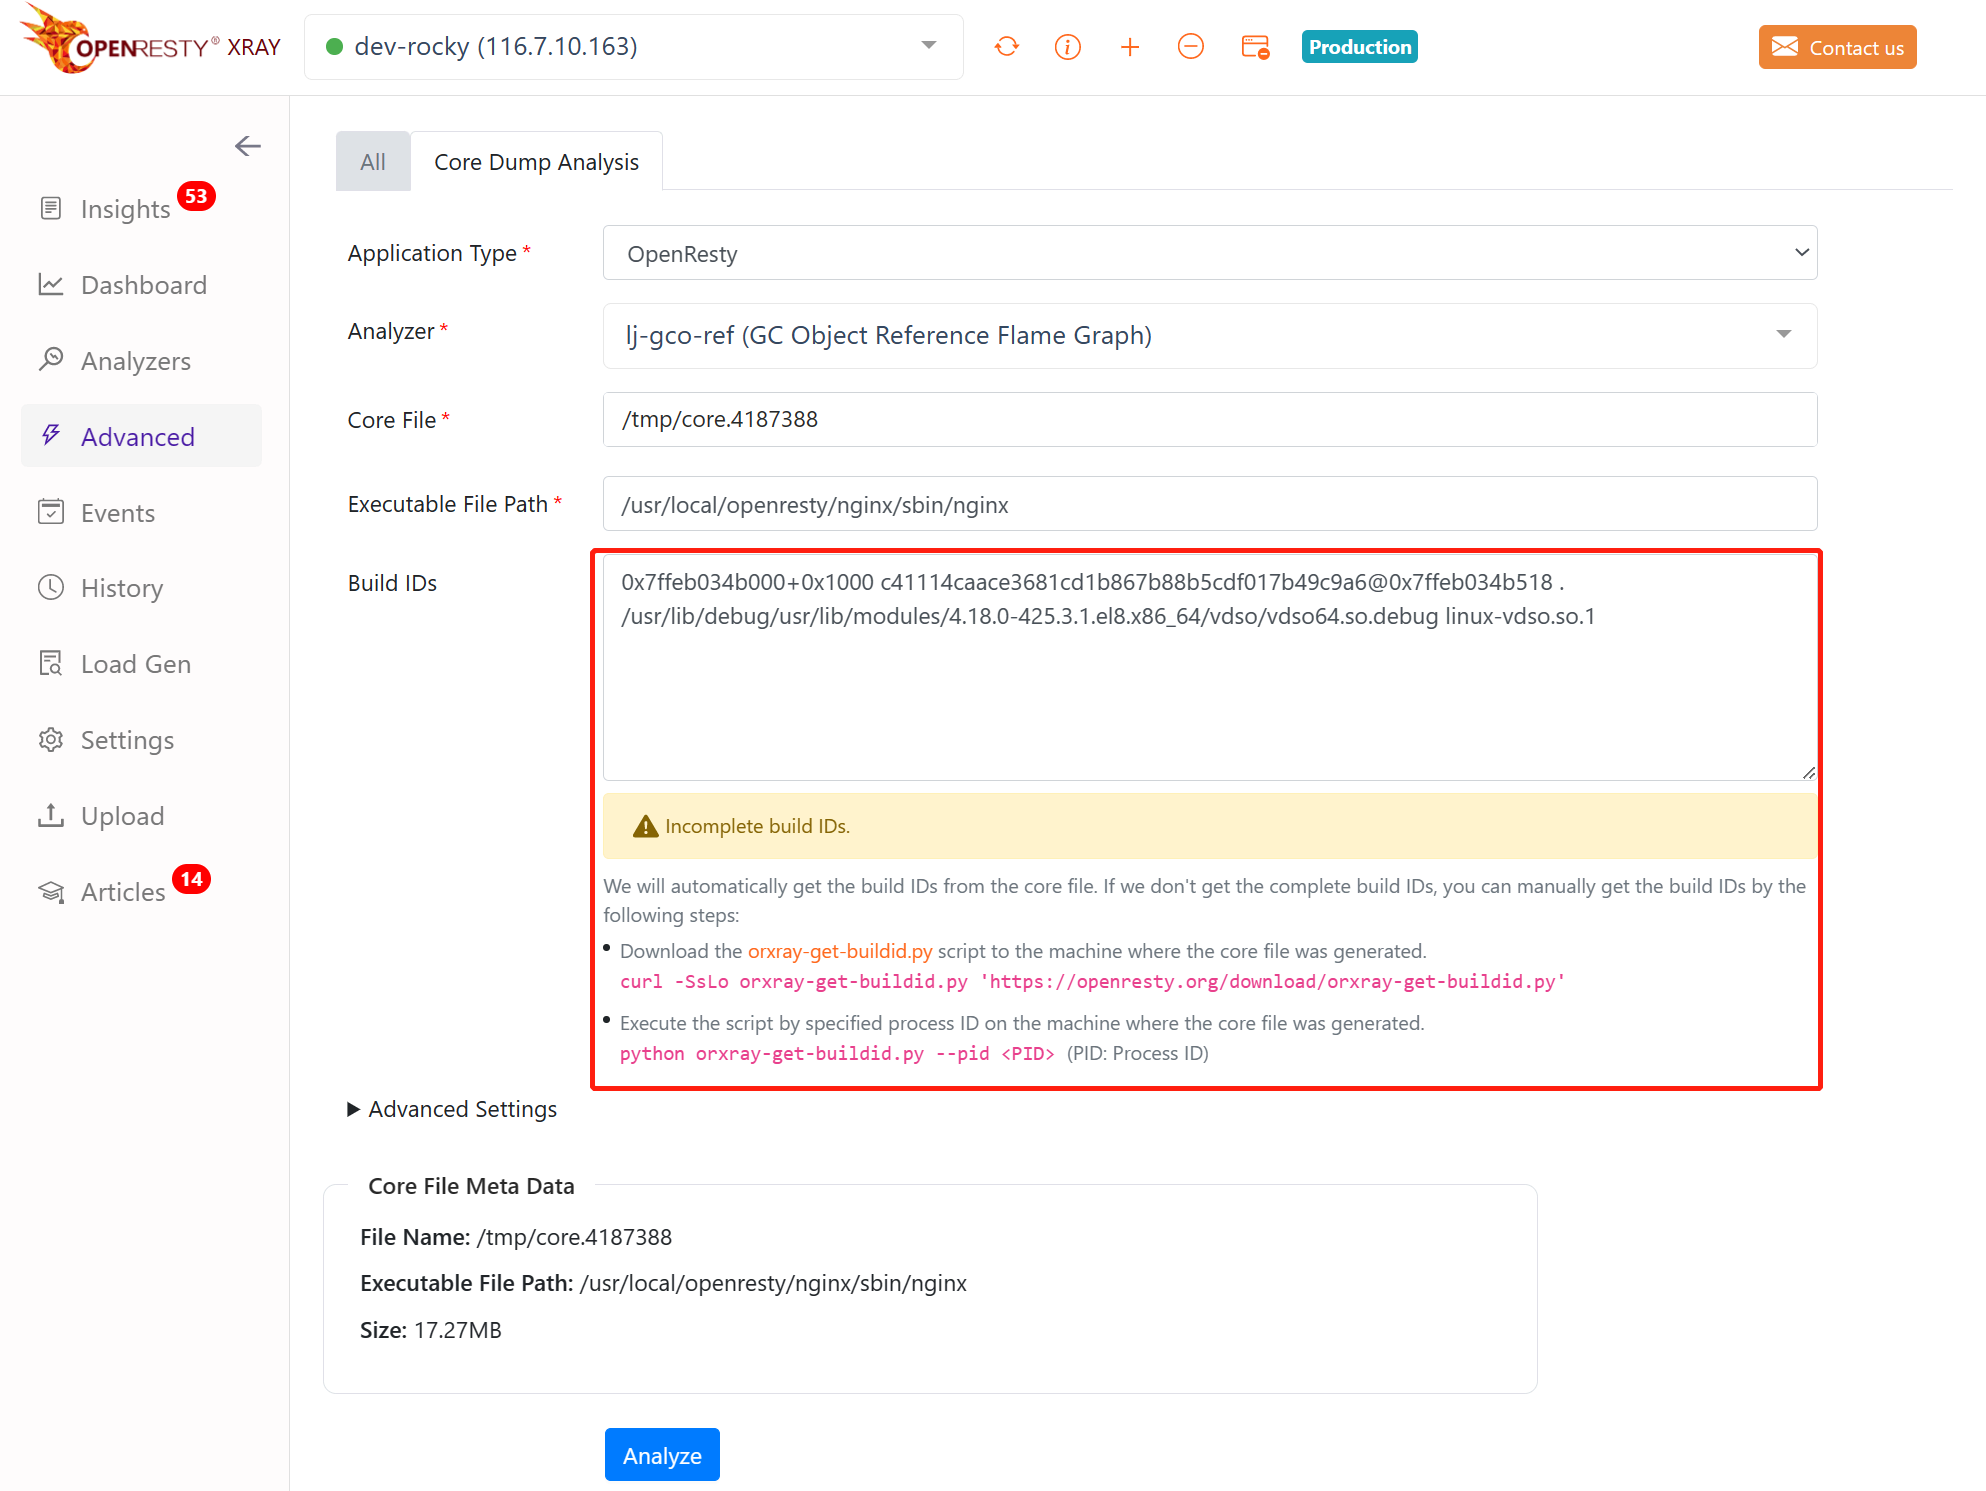
Next, fill in the input box with the location of the core file on the agent’s machine (absolute path).
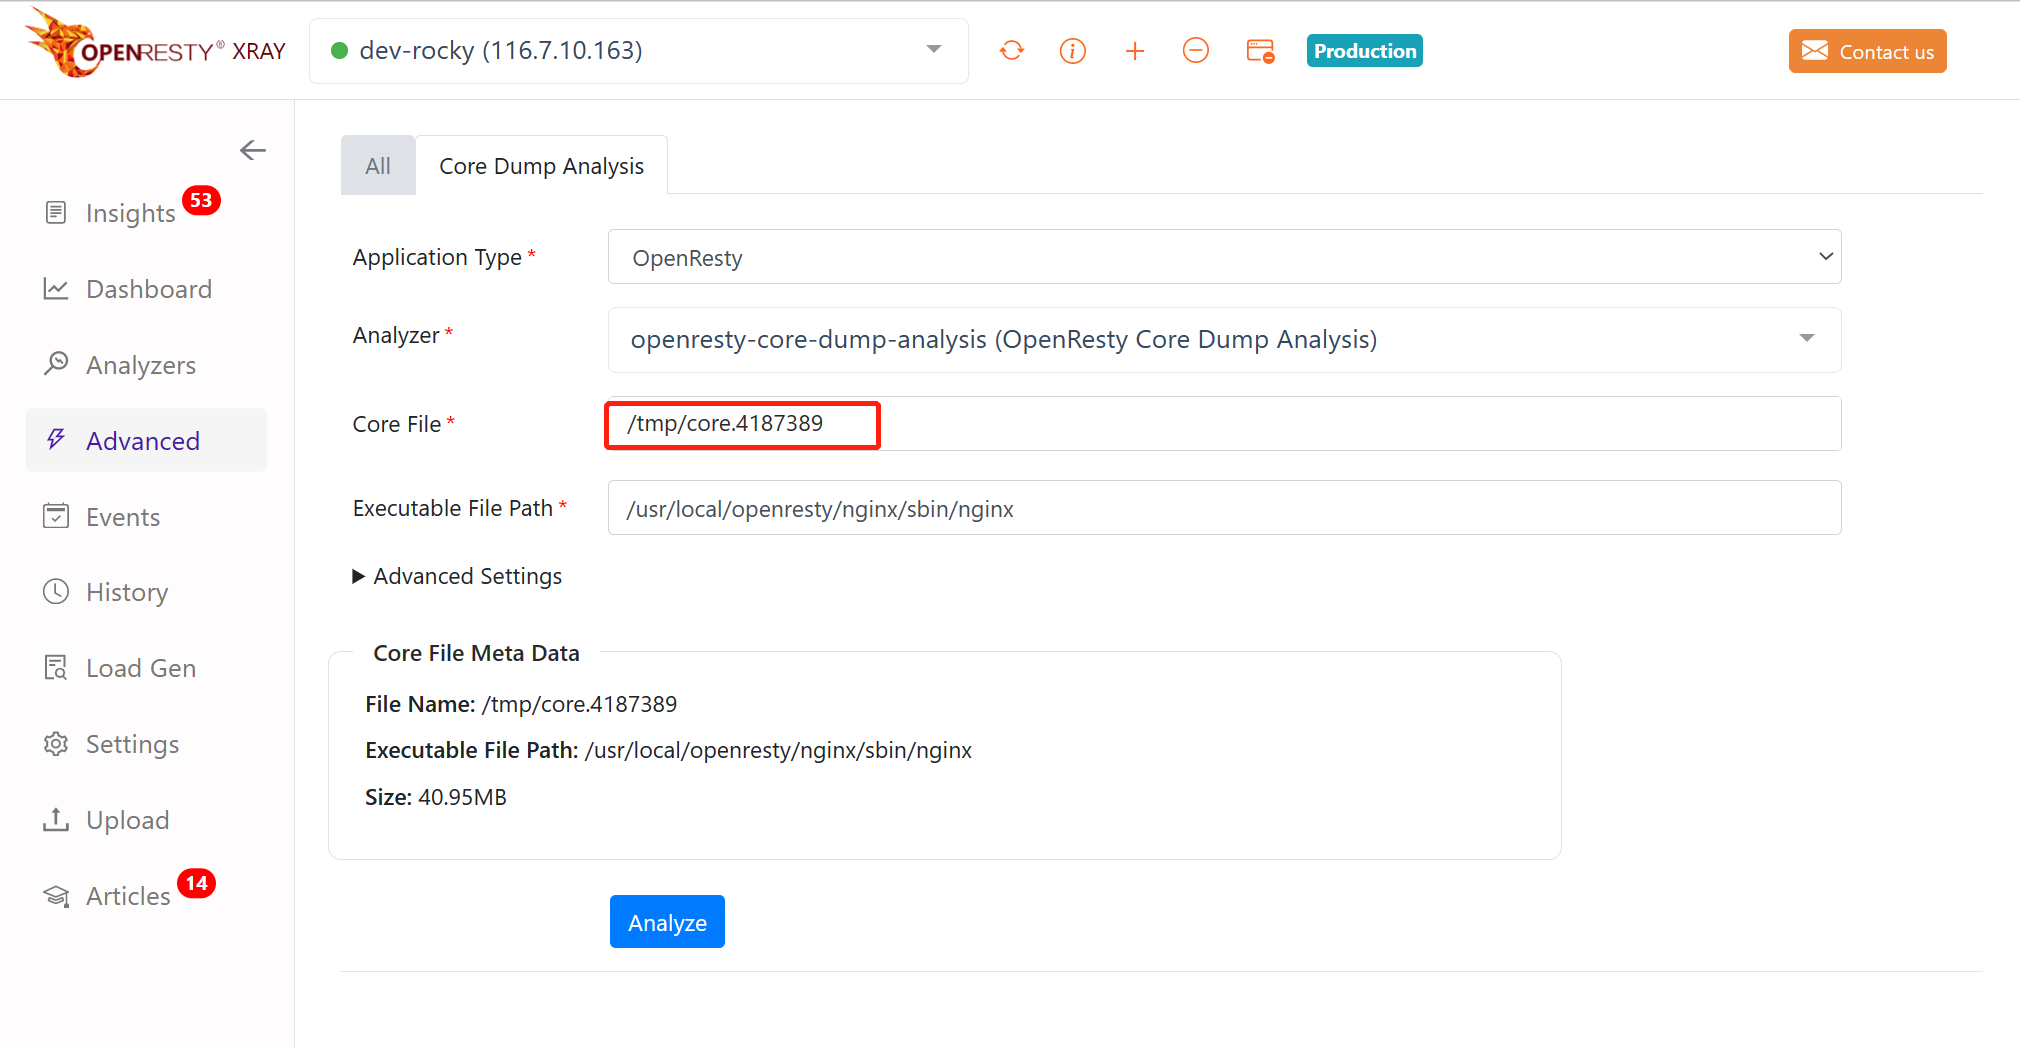
Once completed, our agent will check the core file on the target machine, display the information about the core file below, and automatically fill the executable file path.
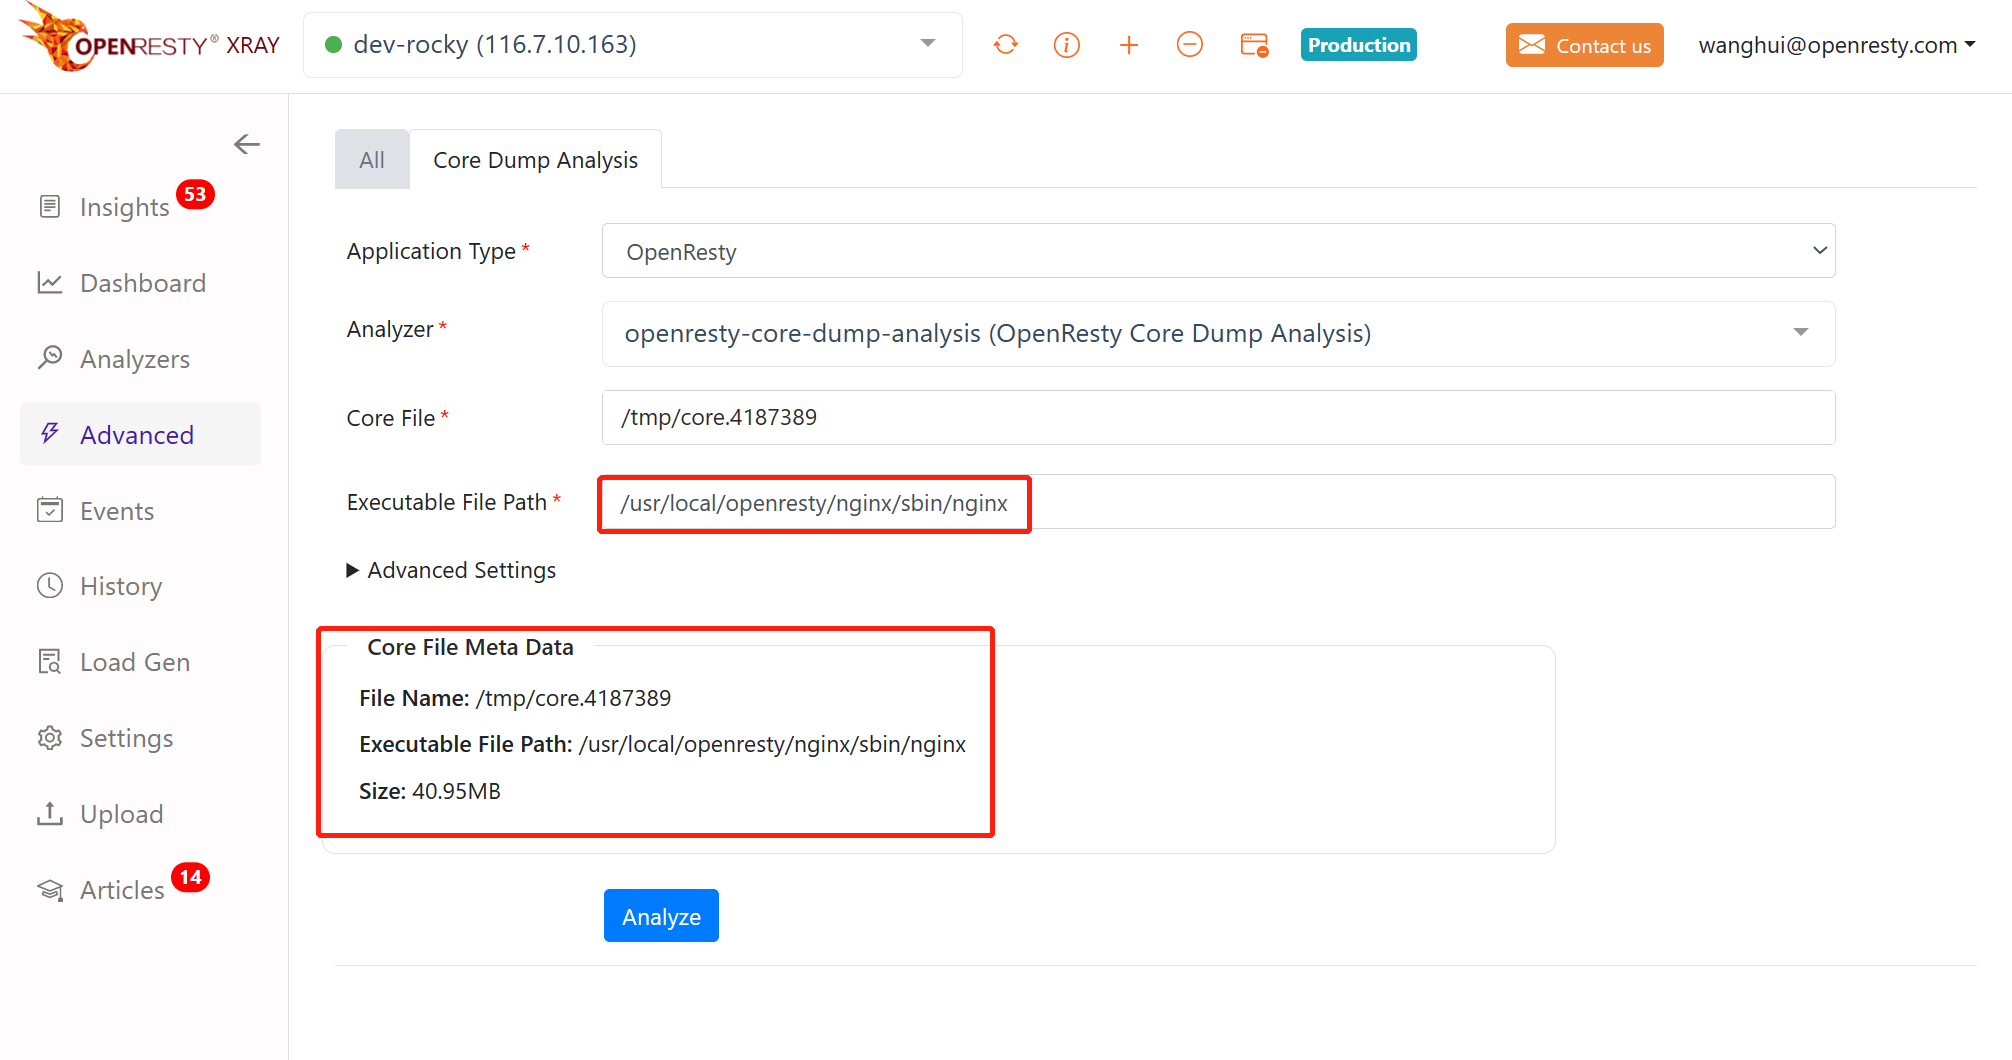
Note: We will automatically extract the list of Build ID (which is a unique ID used to identify the binary) from the core file. If you find that the extracted information is incomplete, you will need to follow the interface prompts to execute the
orxray-get-buildid.pyscript to extract the list of Build ID and fill in the script output toBuild IDs. In this case, the core file is usually generated using a low version of the gcore tool, try using the/usr/local/openresty-gdb/bin/gcoretool installed with the agent.
Click the Analyze button, and the command result will be output at the bottom after running successfully.
In addition to analyzers with strong versatility, we also provide some analyzers for specific scenarios or needs.
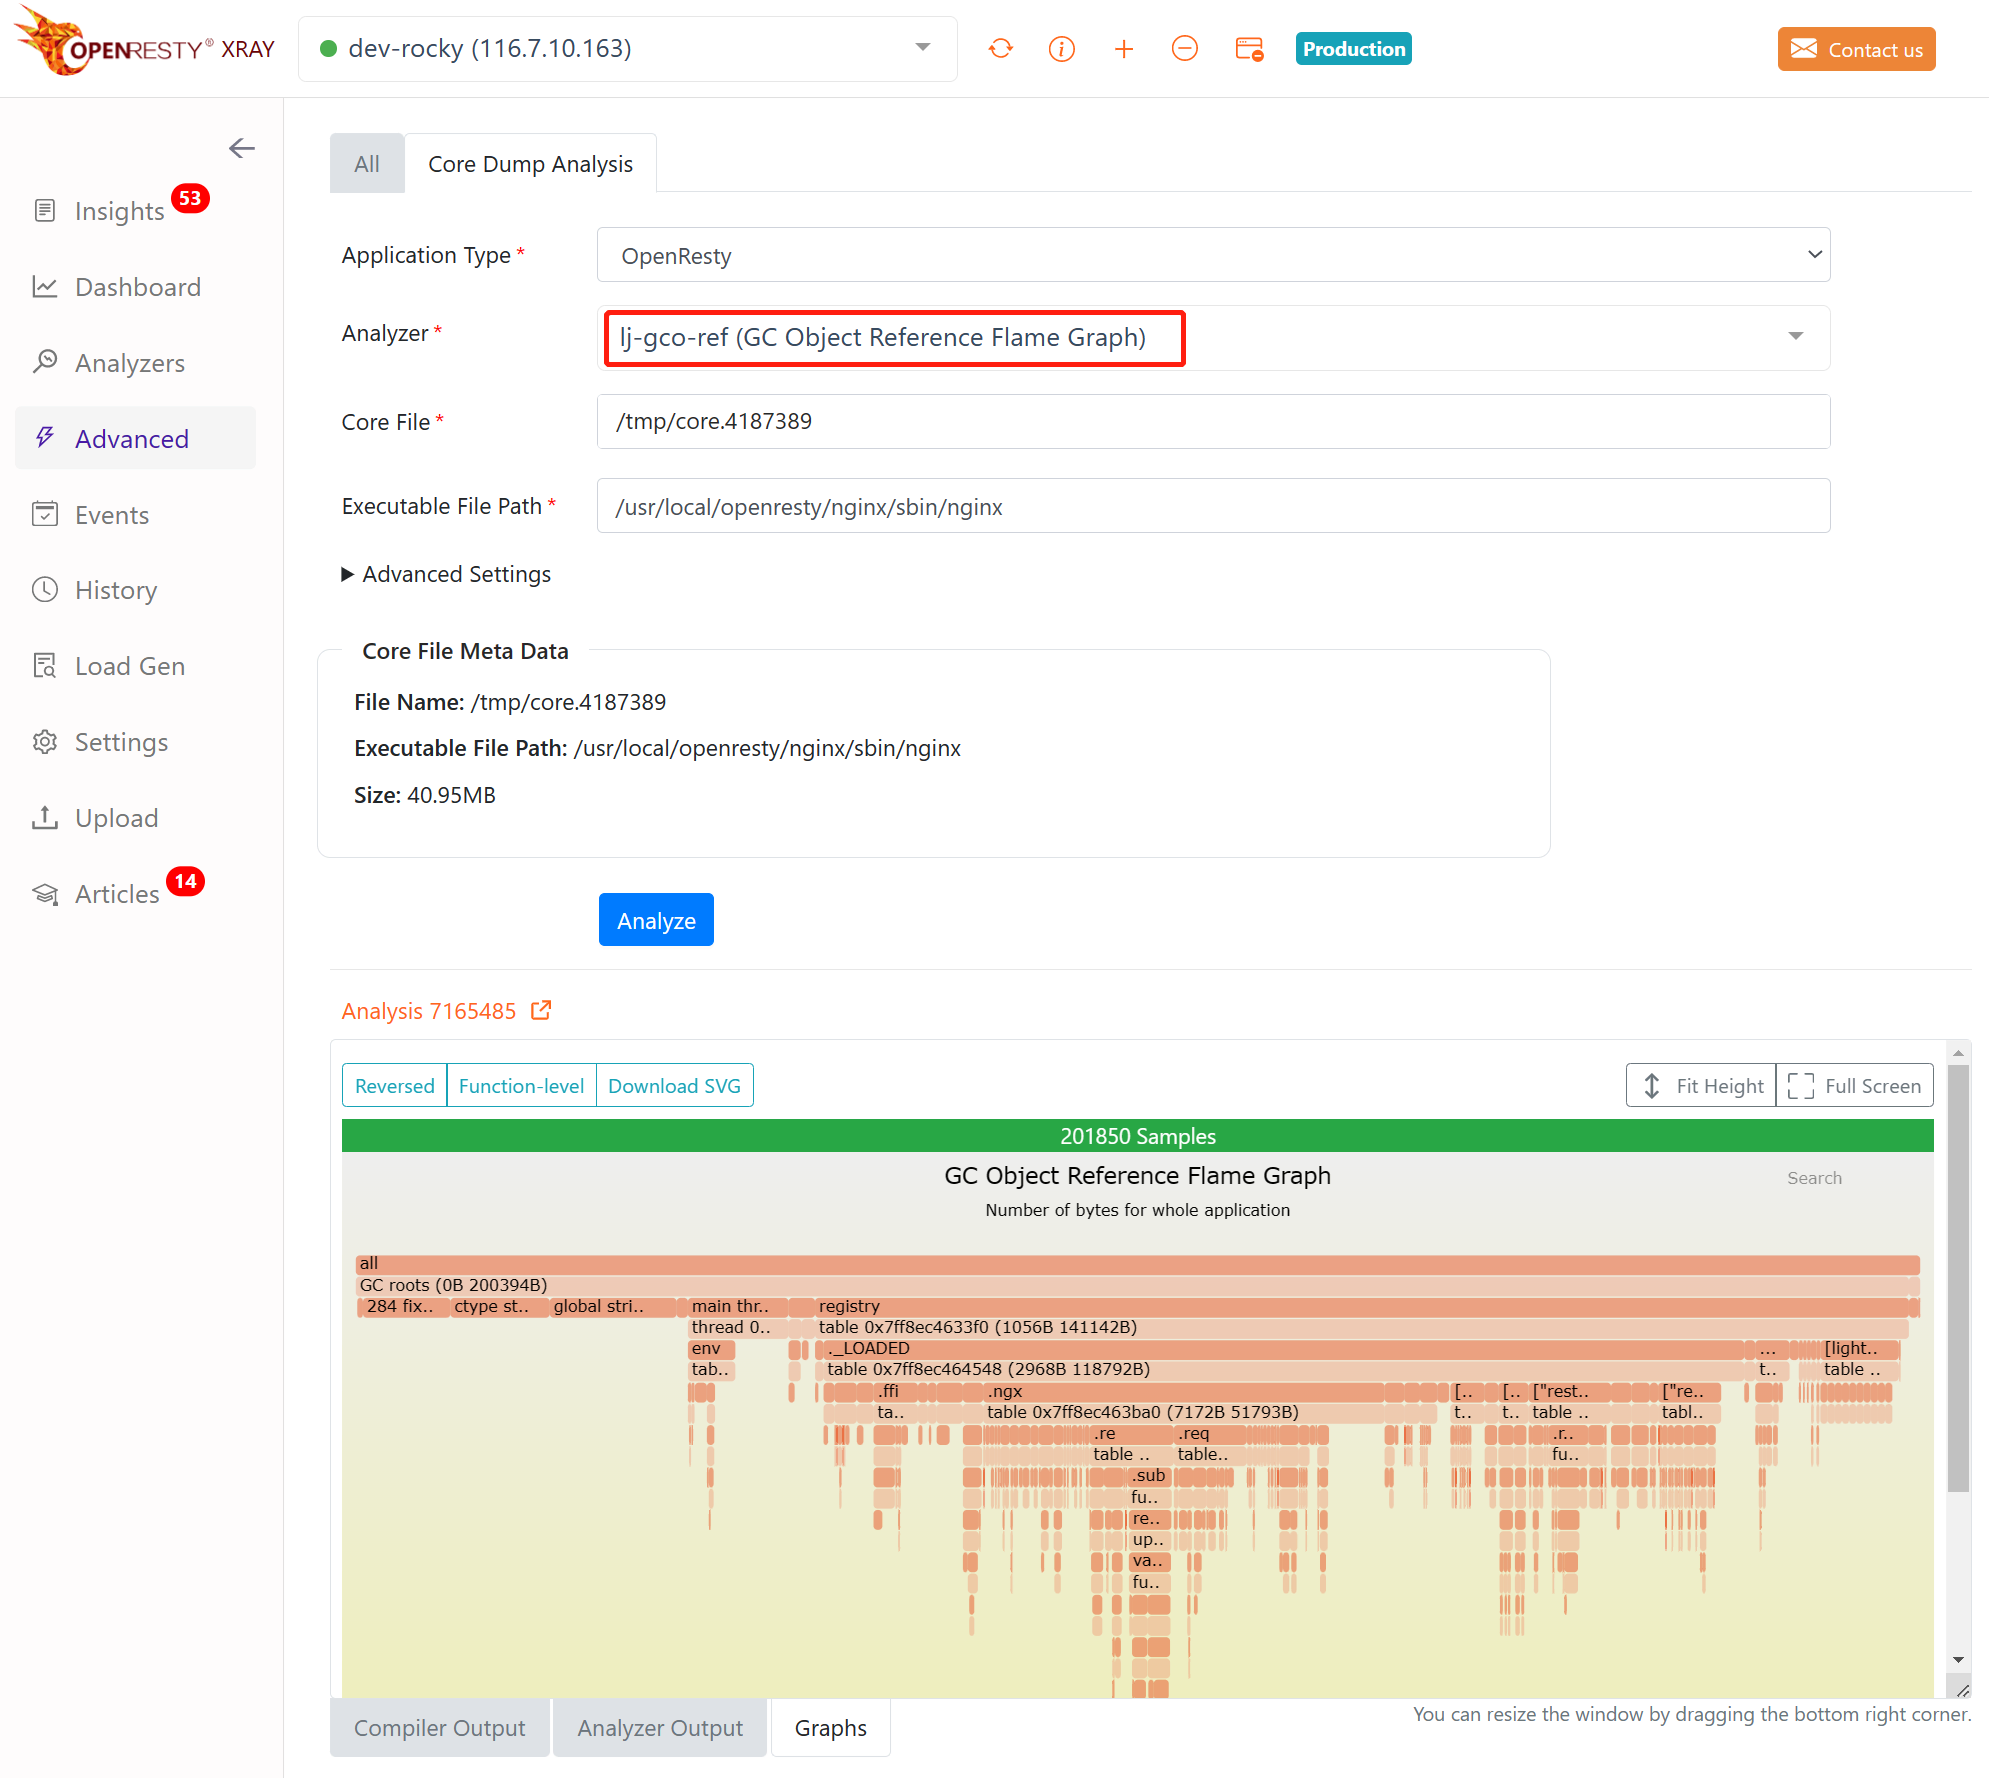
For example, if we want to see the memory references of GC objects in the core file for LuaJIT, we can select the lj-gco-ref analyzer and click the Analyze button. The system will extract and generate a GC object memory reference flame graph from the core file.
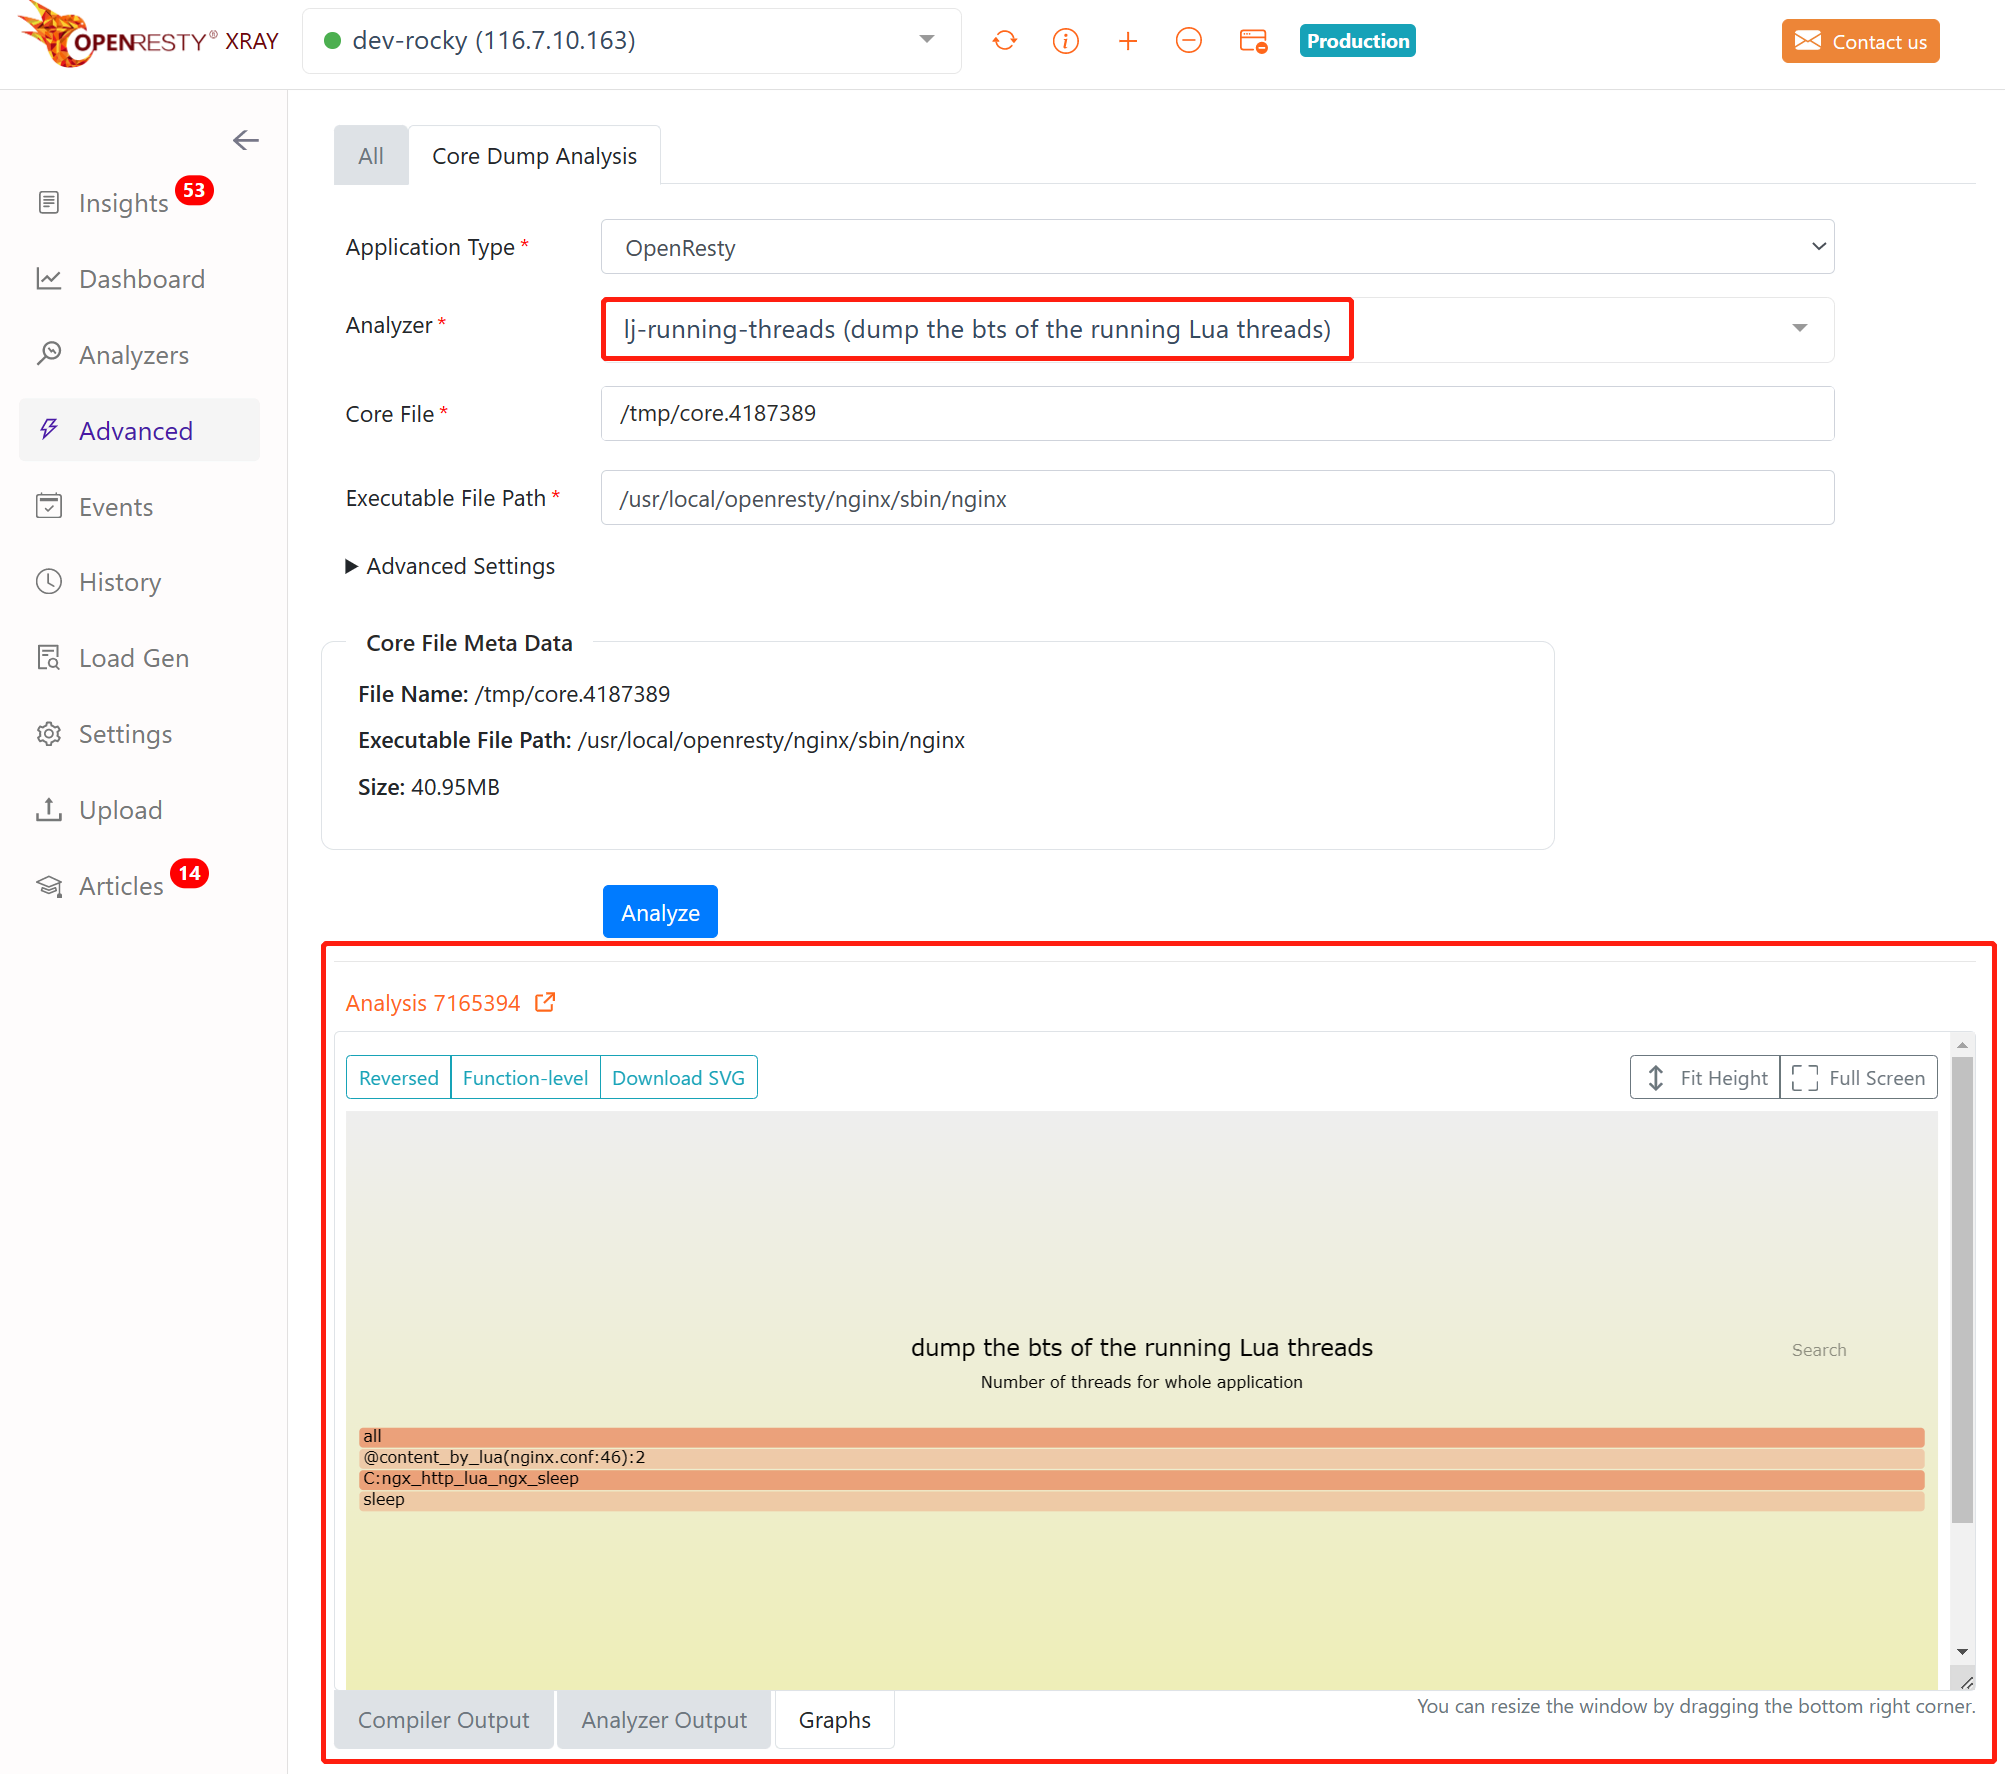
If we want to see the call stack of the currently running Lua threads, we can select the lj-running-threads analyzer.
We have provided standard analyzers that can be used in a variety of common scenarios. However, in some special cases (e.g. core files generated by closed-source C applications), users may need to write their own custom analyzers to meet individual requirements. Please refer to Core Dump Custom Analysis.